
METODOLOGÍA DE TRABAJO
AVS Agroingeniería offers a cargo verification service, enabling clients to obtain real-time information on product quality status while consistently meeting their individual needs. The company is backed by a specialized technical team that optimizes commodity value across major European, Middle Eastern, and Asian markets.
The operational methodology deployed by AVS Agroingeniería consists of the following steps:
On-site deployment of a specialized technician to the packing house or processing center where product conditioning takes place.
Collection and review of available documentation and data regarding the commodities and their transport.
Commodity sampling and performance of applicable control operations, including: visual inspection of commercial maturity and potential defects; measurement of product temperature, firmness, sugar content (Brix), maturity index, juice percentage, etc.
Compilation of photographic evidence documenting cargo condition, product defects, manufacturing, palletization, packaging, and labeling.
To deliver its services, AVS Agroingeniería utilizes ArcGIS Survey123 and ArcGIS Dashboards, both integrated within the ArcGIS Online cloud platform.
ArcGIS Survey123 enables the collection of inspection data via mobile technology and smart forms, eliminating the need for manual paper-based logs and providing real-time access to information.
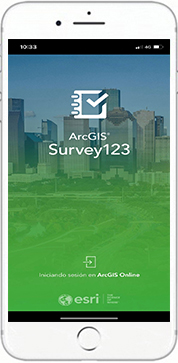
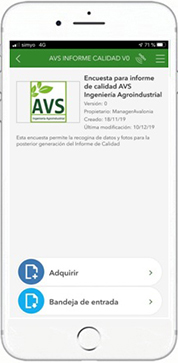
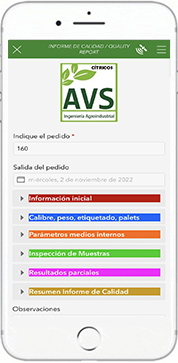
ArcGIS Dashboards provides a dashboard that uses charts, maps, and other visual elements to display the location of the handling center during product packaging, as well as the content and results of inspections in real time.
Furthermore, it enables tracking of the cargo’s location via geolocation data provided by temperature data loggers, which are standard equipment in temperature-controlled freight transport.
By assigning unique login credentials, each client can securely access the quality control results conducted by AVS Agroingeniería. Inspection results are available in real time, and a comprehensive, itemized report is automatically generated and sent to the client upon completion of the inspection.
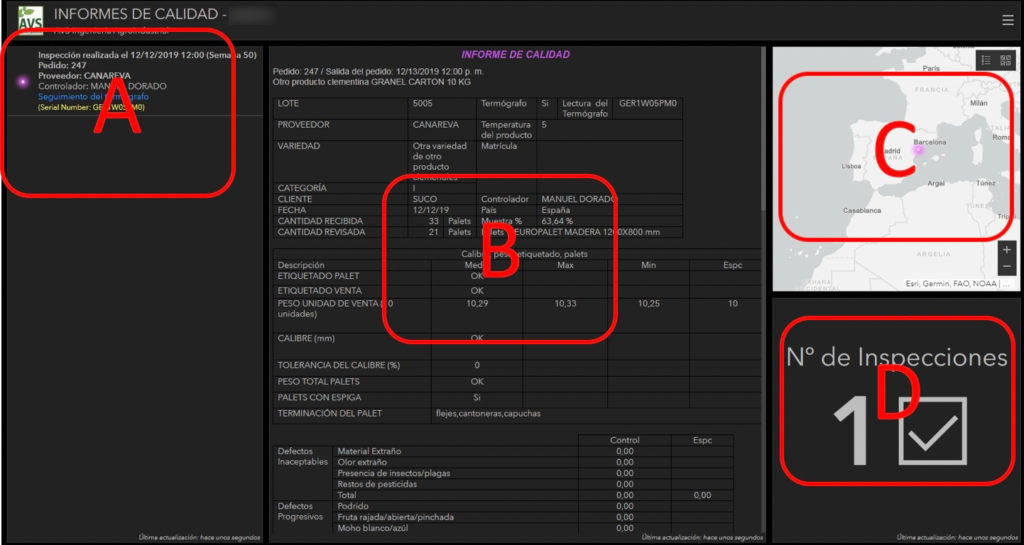
SECTION A: INSPECTION SELECTOR
Displays the most relevant inspection data. It features a link to track the transport vehicle’s position if the temperature data logger provides geolocation. Users must click the link and enter the data logger’s serial number. As the selection changes, the location details, photographs, and inspection content update dynamically.
SECTION B: INSPECTION PHOTOGRAPHS AND CONTENT DETAILS
Based on the selected inspection, users can review the detailed photographs and the quality parameters monitored during the inspection.
SECCIÓN C: MAP.
Displays the geographical location where the inspection was conducted.
SECTION D: METRICS / INDICATORS.
Records and displays the total number of inspections performed.
Once the inspection is completed, a comprehensive report is generated, compiling data on the overall condition of the product, as well as its conditioning and transport. This report is supplemented with photographic evidence, enabling clients to make informed decisions regarding cargo suitability. This proactive approach helps prevent the negative consequences arising from destination delivery of a product that fails to comply with customer specifications and/or marketing standards for fresh fruit and vegetables.


